An interactive atlas of the ideas, people and connections that shape our built environment.
A housing shortage does not know which university department it belongs to. Neither does a flood, a declining town centre or a neighbourhood where the people who keep it running can no longer afford to live. We divide the built environment into disciplines because institutions need departments, professions need qualifications and contracts need a scope. The places themselves remain stubbornly connected.
This creates a curious situation. We have more knowledge about cities, buildings and landscapes than ever before, yet much of it sits in separate rooms. Architects discuss space and construction. Planners discuss land, institutions and development. Landscape architects discuss living systems, water and time. Economists, sociologists, public-health researchers and political thinkers investigate conditions that shape the possibilities of all three. Everyone can be working on the same place while reading different books and asking different questions.
The Built Environment Atlas is an attempt to open the doors between those rooms.
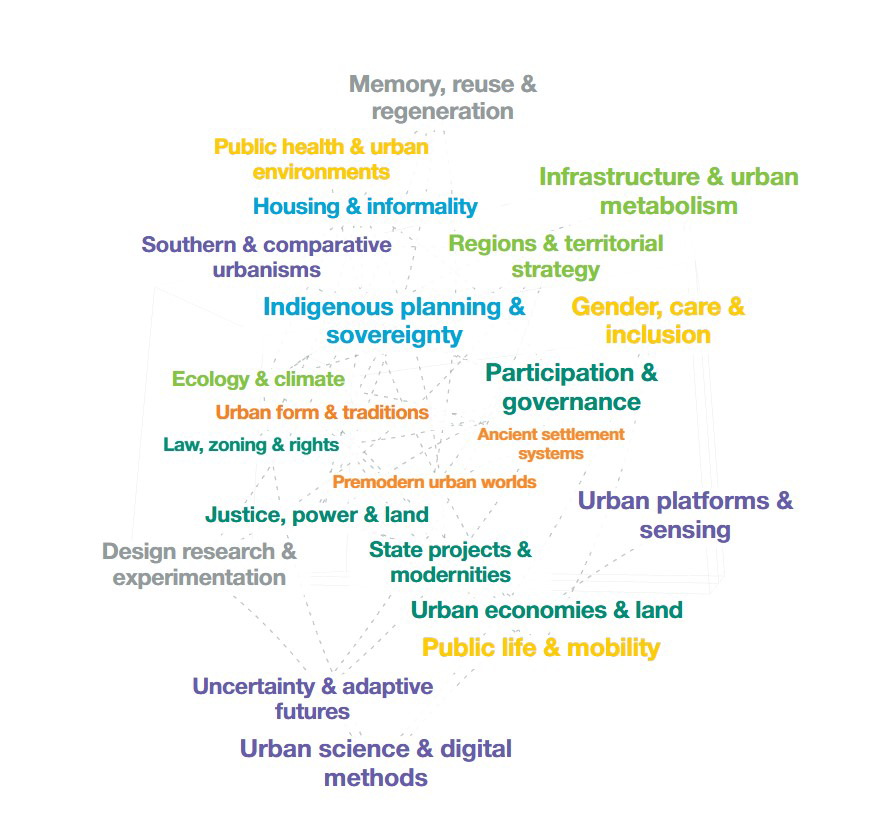
It takes the form of an interactive word cloud, or rather a series of clouds within clouds. Four switches M, L, A and + offer entry points into masterplanning, landscape, architecture and the wider fields that matter to spatial practice. Click a topic and another layer opens: people, practices, institutions, concepts and questions. Continue into a contribution and you find selected projects, publications, exhibitions or other sources that explain its position. Connections lead sideways as well as deeper.
That sideways movement is the point. A discussion about housing can lead towards land economics, collective ownership, care or rights. A landscape project can open questions about food production, extraction or Indigenous authority. Digital modelling can connect to the politics of measurement and the people whom a dataset fails to represent. The + cloud gives these wider fields their own space, acknowledging that they have questions and traditions which extend well beyond their usefulness to designers.
Time provides another way through the material. The vertical timeline runs from early settlements at the bottom towards the present at the top. Moving it changes which documented contributions are visible, while historical time also gives depth to the cloud. It becomes possible to follow how the field accumulates: older ideas remain available as later approaches emerge, challenge them or ask different questions.
This matters because professional history is often presented as an orderly succession. One movement arrives, another replaces it, and eventually the story reaches us. Actual practice is less tidy. In a single city, inherited land arrangements, modern infrastructure standards, informal negotiations and contemporary climate models may all shape the same decision. Understanding that coexistence is often more useful than remembering which movement came next.
The atlas also seeks a wider geographical frame. Greek and Roman references sit within a history that includes settlement systems, practices and knowledge from across the populated continents. Indigenous planning, African urban thought, Asian housing institutions and Latin American debates about land and rights belong within the main conversation. Their inclusion changes the questions we ask, including the uncomfortable question of whose experience has been allowed to stand for everyone else’s.
The map remains selective. Its current version contains 64 topics, 240 profiles and 192 key questions. Those numbers describe a starting collection, not the boundaries of the subject. Some traditions are easier to document through accessible online sources than others. Some practices leave books and archives; others survive through maintenance, collective action and knowledge passed between generations. Making a map also means deciding what it cannot yet show.
The connections require similar care. A line between two names can imply more certainty than the evidence supports. The atlas therefore distinguishes documented influence from shared references and editorial comparisons. Two contributions may illuminate the same question without their authors having met, read one another or agreed about the answer. The connection is an invitation to investigate.
For students and teachers, the atlas can help build a reading route around a question rather than a disciplinary syllabus. For practitioners, it can widen the frame of a brief before a solution becomes fixed. For researchers, it can suggest adjacent arguments, cases and methods worth examining. And for anyone curious about how places are made, it offers a way to wander with sources close at hand.
It is particularly useful at the beginning of a project, when the most consequential decision may still be the definition of the problem. Before asking what should be built, it helps to ask who controls the land, whose work sustains the place, what environmental systems cross its boundaries and which outcomes would count as improvement.
The tool is freely available to explore and use. It can also be embedded in a website or blog post, keeping the interactive cloud, timeline and information panels within the page. Teachers can place it beside course material, practices can use it alongside a project discussion, and writers can let readers follow connections beyond an article. The linked books, papers and other materials retain their own access conditions.
The built environment already connects these fields in practice. A decision about a street distributes access, money, risk, time and opportunity, whether its designers discuss those relationships or leave them implicit. The atlas makes some of those connections visible – and gives us somewhere to begin following them.
AI tools have been used for coding the research, coding, spelling, grammar and text enhancement.